


Style Allocation & its relevance to investors?


Background
Discussions on asset allocation have so far focused around diversification amongst asset classes i.e. Equities, Fixed Income, Non-financial assets (Real estate and Gold). There has been little emphasis on discussing Style allocation within a particular asset class, e.g. within equity as an asset class, we are yet to achieve a deeper emphasis on market cap allocation (Large cap vs. Mid / Small Caps), allocation within sectors through different themes.
In this article, using a thorough analysis of 2021 market performance, from the prism of the quantitative practitioner, we intend to shed light on the significance of recognizing style exposure in one’s investment portfolio. As a corollary, the next step would naturally be to focus on making active allocation decisions with regards to the same. To be fair, a few financial portals already do classify fund offerings based on a matrix of Market Cap vs. Style exposure. However, this approach has not garnered enough mainstream attention yet.
What is Asset Allocation?
Simply put, it is the allocation of an investor's portfolio amongst different asset classes. To start off, in order to make such a generalization, the first step is to define the number of asset classes. Once defined, this information can be aggregated to determine the investor's overall effective asset mix. If it this is not in-line with the desired mix, appropriate changes can then be made.
How does Style fit into the Asset allocation decision?
If we stick to allocation within equities, then various research papers in developed markets and anecdotal evidence in our market has proved that much of the performance variation i.e. Outperformance / underperformance can largely be attributed to 3 key dimensions:
1. Market cap exposure: Allocation between Large / Mid / Small Cap
2. Sector concentration / diversification
3. Style based investing
The third dimension can be expanded to Growth, Value, and Quality in our markets. If we look at 2021 for instance, below is the performance of the underlying styles through time.
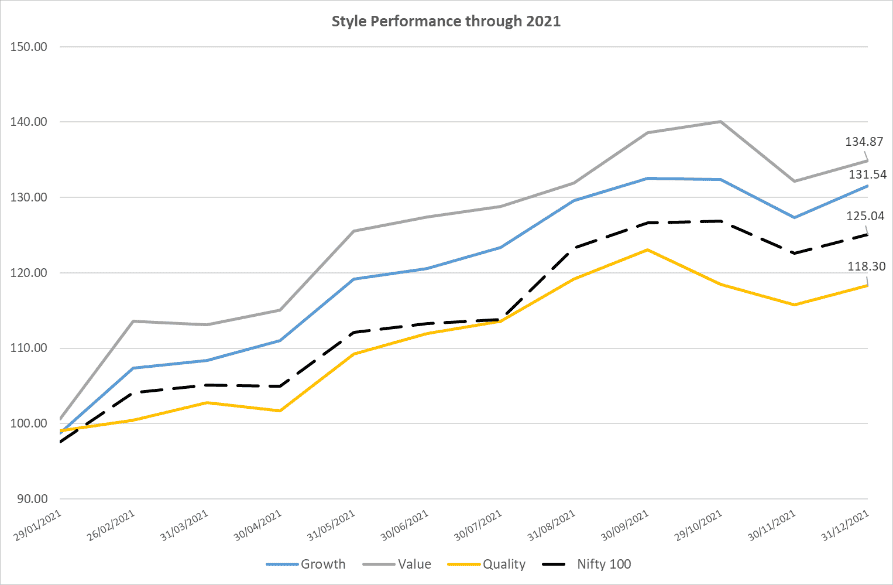
Let’s have a look at the key takeaways from this analysis:
- Performance of Value as an investing style was noteworthy
- Growth saw an uptick in performance during the latter half of the year to finish a close 2nd
- Quality struggled through the year except for a brief period between May-July when it surpassed markets
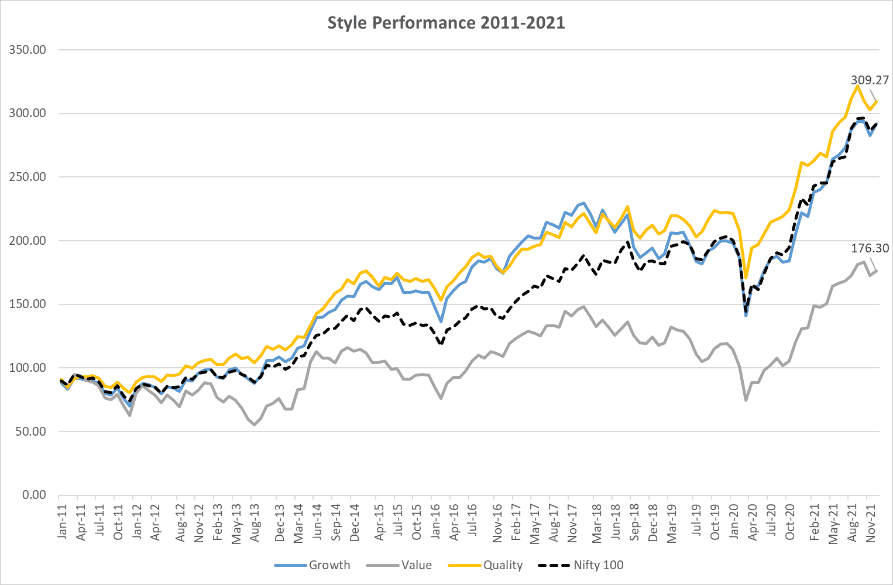
However, if we look at the longer history and analyze the outperformance on a yearly basis to Nifty 100, we come to realize that there is an inherent cyclicality in the performance of these styles, just like it is in the case of asset returns.
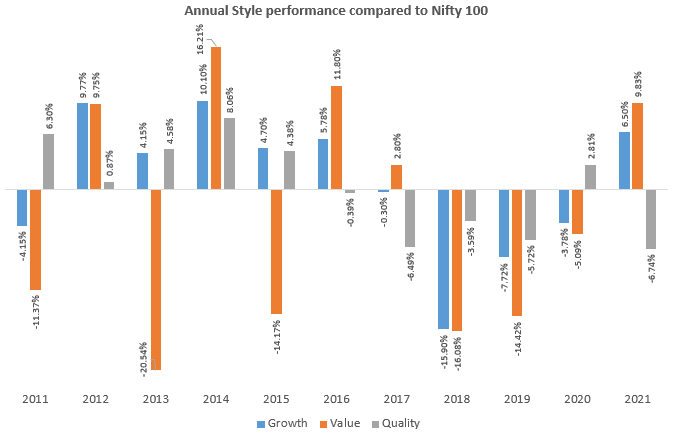
For the purpose of the analysis, Growth bucket has been identified as the Top 33% of the companies based on growth expectation over the next 12 months in the Nifty 100. Value means the Top 33% of the companies based on standard valuation measures (P/E, P/B, Div yield). Quality means the Top 33% of the companies based on return ratios and the underlying volatility of the stock.
Main takeaways from longer term analysis are:
- Aside from 2021, value experienced a few volatile years
- Quality was the better performing style, especially in the 1st half of the decade which moderated over the 2nd half
Conclusion
This cyclicality in style performance has also been attributed amongst other things to macro environment. Growth, for instance, has been perceived to be rewarding during low volatility and benign interest rate regime. On the contrary, Value has been known to do well during high volatility and increasing interest rate environments. However, to time this cycle is difficult for the retail investor and is akin to trying to time the markets. Instead, a better approach would be to stay disciplined through the cycle.
Like investors emphasize on allocating percentage of their wealth to different asset classes, they should also evaluate style exposures in their underlying funds, irrespective of the market cap or sector bias and diversify accordingly. If not, then there is a danger of overrepresentation of a particular style in their portfolio, as each of these styles go through their own performance cycles. Lastly, these styles represent the basic building blocks of the markets investment philosophy and while they may experience long periods of Out/(Under) performance, all of them will continue to drive the markets globally.
Disclaimer
Source of Data: Axis MF Research, Bloomberg.
This document represents the views of Axis Asset Management Co. Ltd. and must not be taken as the basis for an investment decision. Neither Axis Mutual Fund, Axis Mutual Fund Trustee Limited nor Axis Asset Management Company Limited, its Directors or associates shall be liable for any damages including lost revenue or lost profits that may arise from the use of the information contained herein. No representation or warranty is made as to the accuracy, completeness or fairness of the information and opinions contained herein. The material is prepared for general communication and should not be treated as research report. The data used in this material is obtained by Axis AMC from the sources which it considers reliable.
While utmost care has been exercised while preparing this document, Axis AMC does not warrant the completeness or accuracy of the information and disclaims all liabilities, losses and damages arising out of the use of this information. Investors are requested to consult their financial, tax and other advisors before taking any investment decision(s). The AMC reserves the right to make modifications and alterations to this statement as may be required from time to time.
Axis Mutual Fund has been established as a Trust under the Indian Trusts Act, 1882, sponsored by Axis Bank Ltd. (liability restricted to Rs. 1 Lakh). Trustee: Axis Mutual Fund Trustee Ltd. Investment Manager: Axis Asset Management Co. Ltd. (the AMC) Risk Factors: Axis Bank Limited is not liable or responsible for any loss or shortfall resulting from the operation of the scheme.
Mutual Fund Investments are subject to market risks, read all scheme related documents carefully.
Calculator
View All


Mutual fund investments are subject to market risks, read all scheme related documents carefully.
Copyrights ![]() 2020. All rights reserved Axis Mutual Fund.
2020. All rights reserved Axis Mutual Fund.
Privacy | Terms | Disclaimer | Sitemap